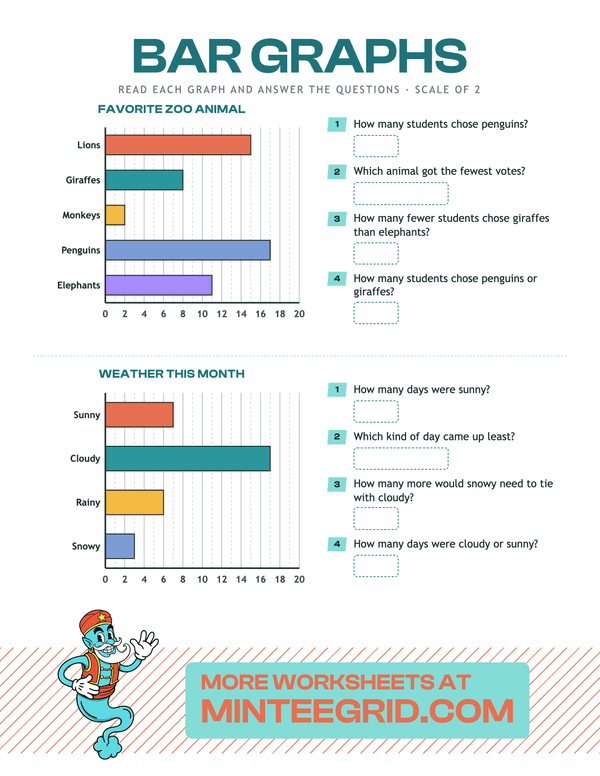
Read the bars, then answer the questions
How many more chose soccer than football? A bar graph question is a subtraction problem in disguise — and on a scale of 2, the bar that ends between two lines is where children slip.
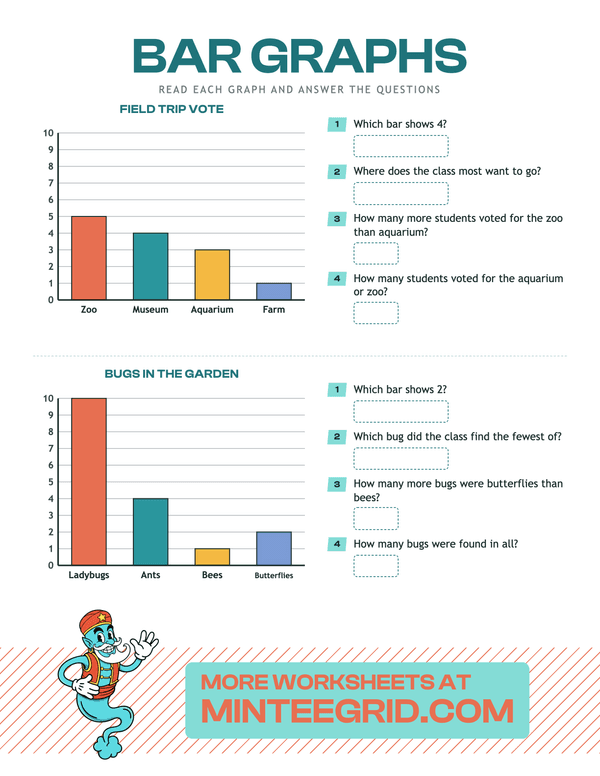
Find the top of the bar, then read across.
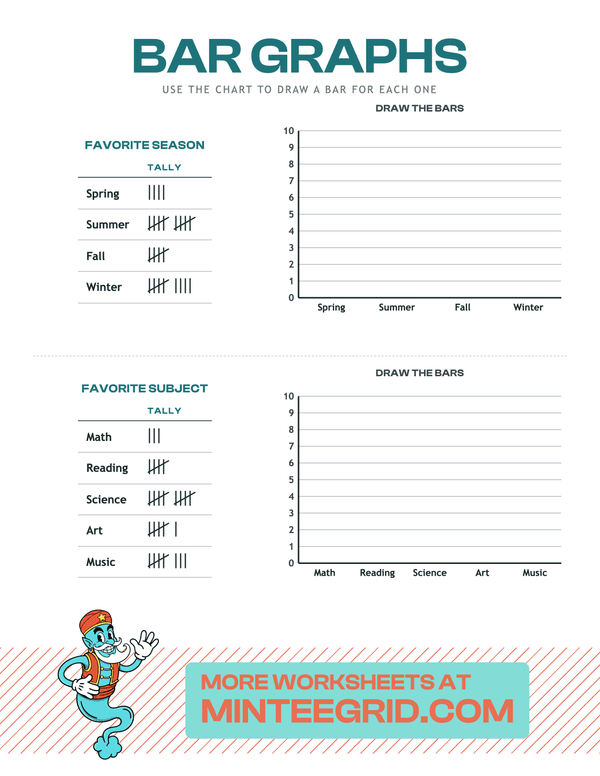
A bar graph worksheet generator, printable as a PDF. Two graphs a page, each a class survey — twenty-two of them, from favorite fruit and pizza toppings to the field trip vote, the food drive and the birds at the feeder. Bars stand up or lie on their side. Read mode asks four questions a graph, one of each kind a test asks, mixed from nine: how many chose one or which bar shows a number; which got the most or the fewest; how many more, how many fewer, or how many to tie; how many in all, or two together. Draw mode gives a tally chart, or a table of numbers at the bigger scales, and an empty graph to draw the bars on; the answer key draws them. The scale counts by 1s for second grade or by 2s and 5s for third grade's scaled bar graphs. With an answer key.
1 token a sheet, fewer in batches.
US Letter PDF — prints on any home printer.
Find
Follow the bar to its top.
Read across
Go straight left to the number scale.
Answer
Compare bars: subtract for “how many more.”
Activity
Four questions a graph, mixed from nine kinds: how many, which bar shows, most, fewest, how many more, how many fewer, to tie, in all, two together.
Scale
Bars
Your worksheet lands here — download, print, or email it.