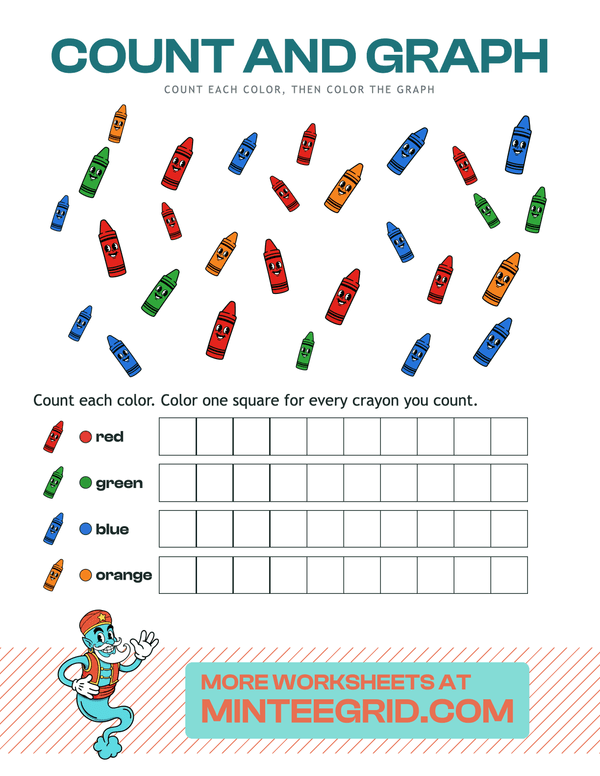
Count it, then graph it
Sorting and counting by color, then turning the count into a graph — the whole of kindergarten data on one page.
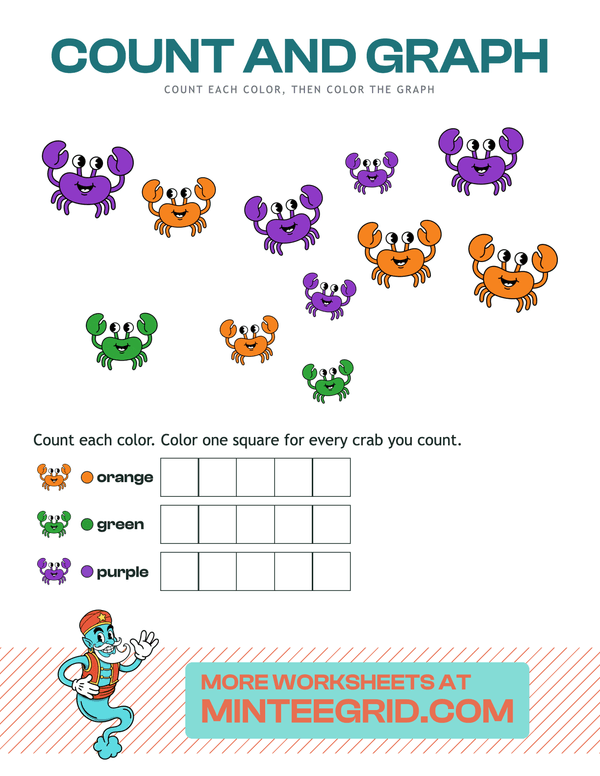
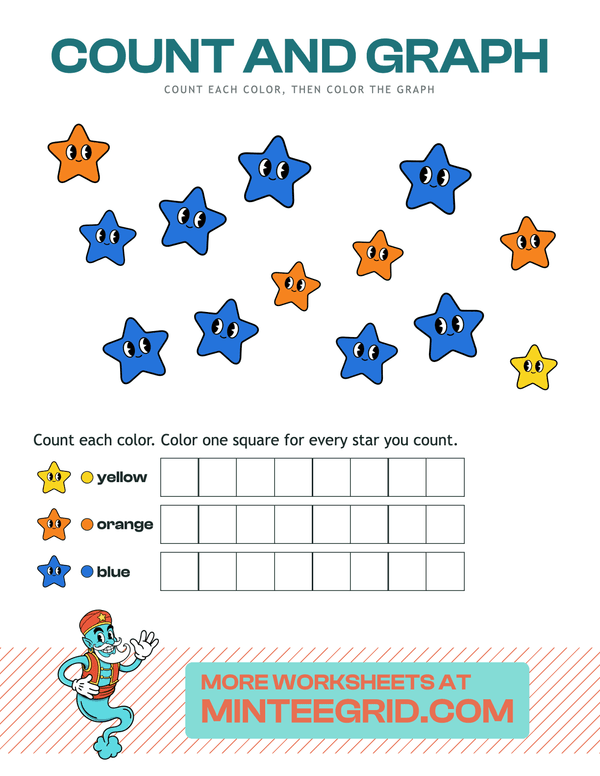
Count each color, then color the squares.
A count-and-graph worksheet generator, printable as a PDF. One picture in three or four colors is scattered over the top of the page; underneath is a graph lying on its side, one row per color, with the colored picture at the start of each row. The child counts each color and colors that many squares. Easy goes up to 5 of each, medium to 8, hard to 10 with four colors. The answer key fills the graph and writes the counts.
1 token a sheet, fewer in batches.
US Letter PDF — prints on any home printer.
Count
Count the ones of one color. Cross them off as you go.
Color
Color that many squares in the row for that color.
Compare
Which row is longest? That color has the most.
Theme


Difficulty
Three colors, up to 5 of each.
Your worksheet lands here — download, print, or email it.