How to read a bar graph (and why scaled graphs trip kids up)
October 12, 2026 · 6 min read
Reading a bar graph is three moves: find the top of the bar, read straight across to the scale, answer the question. Most children can do the first two by the end of second grade. The third is where points get lost — because graph questions are word problems in disguise.
Step zero: read the graph before the bars
Before looking at any bar, read the title and the labels. "Favorite Fruit" counts students; "Books Read This Week" counts books. A child who skips the title will answer "how many students" questions about books, and it happens more than you'd think.
Lifehack: have your child finish the sentence "This graph shows how many ___" before answering anything. If they can't, they haven't read the graph yet.
Finding the value of a bar
Follow the bar up to its top, then go straight left to the numbers. On a small graph that's easy. On a busy graph, eyes drift to the wrong line.
Lifehack: lay a ruler or the edge of a sheet of paper flat across the top of the bar. It gives the eye a straight line to follow to the scale — and it's the same trick adults use with spreadsheets.
The four questions, and what they really ask
Almost every bar graph question on a US worksheet or test is one of four types:
| Question | What it really asks |
|---|---|
| How many chose apples? | Read one bar. |
| Which got the most? | Find the tallest bar — answer with a label, not a number. |
| How many more chose apples than grapes? | Read two bars, subtract. |
| How many in all? | Read every bar, add. |
"Which got the most" trips children who answer "9" instead of "apples." "How many more" trips children who add instead of subtract, because "more" sounds like plus. Teach the table above directly; it's short enough to stick.
Scaled bar graphs: the third-grade trap
On a scale of 1, every line is a number. On a scale of 2 or 5, only some lines are labeled, and a bar can end between them. A bar halfway between 6 and 8 on a scale of 2 is 7 — and a child who reads only labeled lines will say 6 or 8.
Lifehack: before reading any scaled graph, ask "what does one line count?" If the labels go 0, 2, 4, 6 — each line is 2, and halfway between two lines is 1 more.
Making graphs teaches reading them
The fastest way to understand bar graphs is to draw one. Give your child a tally chart — favorite ice cream from the family, say — and an empty graph. Drawing the bar for 7 on a scale of 2 forces them to think about where 7 goes, which is exactly the skill they need to read one.
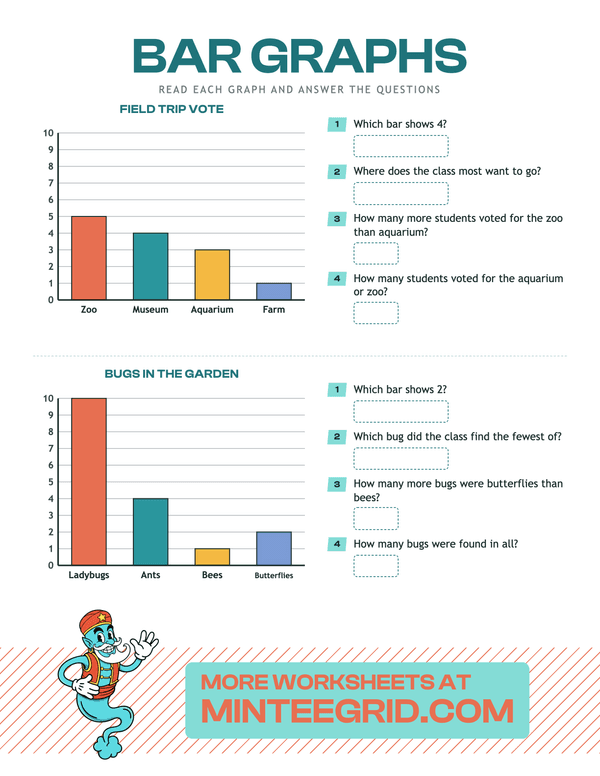
Our bar graph sheets do both: a "read" mode with the four question types, and a "draw" mode with a tally chart and an empty graph, at scales of 1, 2 or 5. The surveys are the kind a US classroom actually runs — favorite fruit, pets, how we get to school.
Try it yourself
Bar Graphs
Class surveys as bar graphs: read one and answer four questions, or draw the bars from a tally chart. Math · 7–9 years.
Run a real survey
Nothing beats data the child collected. Ask five family members their favorite season, tally it, draw the bars, then write two "how many more" questions for someone else to answer. Writing questions is harder than answering them — and it's the best check that the idea has landed.
For the subtraction underneath "how many more," fact families are the quickest route to automatic answers.
FAQ
How do you read a bar graph?
Read the title and labels first so you know what is being counted. Then follow a bar to its top and read straight across to the number scale. To compare two bars, subtract the smaller value from the bigger one; to find a total, add every bar.
What is a scaled bar graph?
A bar graph where each line on the scale counts more than one — by 2s, 5s or 10s. Third graders draw and read them (3.MD.3). The trap is a bar that ends between two labeled lines: on a scale of 2, a bar halfway between 6 and 8 means 7.
What grade learns bar graphs?
Second grade draws picture graphs and bar graphs with a single-unit scale and answers put-together, take-apart and compare questions (2.MD.10). Third grade uses scaled graphs (3.MD.3). First grade starts with organizing data into up to three categories (1.MD.4).
What does 'how many more' mean on a bar graph?
It means subtract: find both values and take the smaller from the bigger. If 9 students chose soccer and 5 chose football, 9 − 5 = 4 more students chose soccer.