First graphs: teaching kindergartners to count and graph
October 20, 2026 · 5 min read
A graph is just counting, written down so you can compare. Kindergartners can do it — they just need to start with real things.
Start with real objects
Tip a handful of crayons on the table. Sort them by color into rows, one crayon beside the next. Count each row. Ask: which color has the most? The fewest? Are any the same?
That is a graph. The rows are bars, and the longest bar wins.
Lifehack: use snack time. Sort a handful of colored cereal or fruit snacks into rows before they get eaten. Kids will count very carefully when the prize is eating them.
Then on paper
The jump to paper is one idea: a square stands for one thing. Color one square for each red crayon, one for each blue. The row of squares is now the row of crayons.
This is exactly what the kindergarten standard asks (K.MD.3): sort, count, compare. Graphs proper come in first and second grade, with reading questions like "how many more?"
Count, then graph
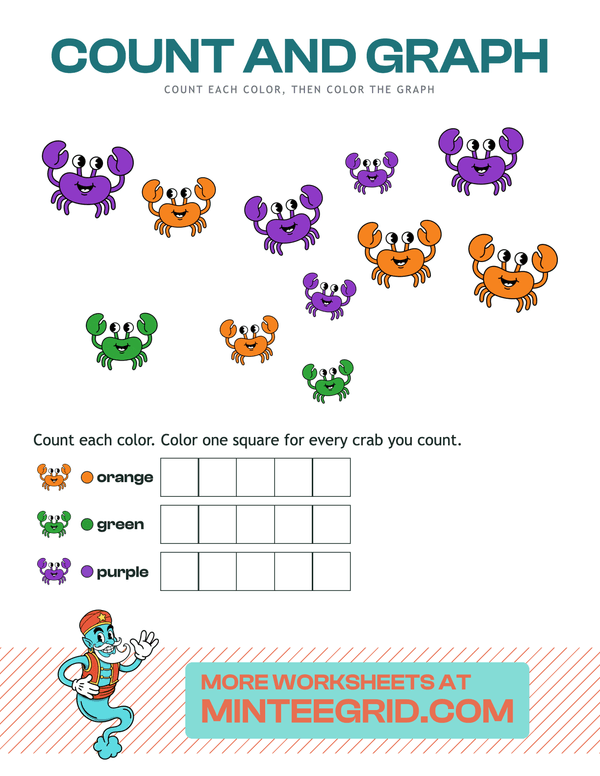
Our Count and Graph sheets put a scatter of one picture — fish, rockets, balloons — in three or four colors at the top of the page, and a graph lying on its side underneath: one row per color, with the colored picture at the start. Count each color, color that many squares, and compare.
Try it yourself
Count and Graph
Count each color, then color one square of the graph for every one you find. Math · 4–7 years.
What to ask after
- Which color has the most? How do you know?
- How many more red than blue?
- How many are there altogether?
Each question is a different math skill — comparing, subtracting, adding — all from one graph. For older children, Bar Graphs has a full set of questions, and our post on how to read a bar graph walks through them.
FAQ
Do kindergartners learn graphs?
Yes, informally. The kindergarten standard K.MD.3 asks children to classify objects into categories, count them and sort the categories by count, which is the start of graphing. Picture graphs and bar graphs come formally in first and second grade.
What is a picture graph?
A graph where each picture or square stands for one thing counted. Each row or column is a category, and the longest one has the most.
How do I explain a graph to a five-year-old?
Line up real objects by color in rows, then count each row. The longest row has the most. A graph on paper is the same thing, with squares instead of objects.